
ATOM ORBITALS v.1.5
Visualization of atomic orbitals of one-electron atom (ion)
Autor: Taras Yu. Zavedy. (С), 2006–2009,Russia,Tomsk region, Seversk.
FREEWARE
Description:
The
program is designed to display the one-electron atomic orbitals of the
solution to the Schrodinger one-electron atom. The application allows
you to render the one-electron atomic orbitals with different quantum
numbers n, l, m and charge Z. Display in two different modes -
using the psi-function and mode of the square of the psi function.
Methods for rendering - the point, ball voxels, and the elementary
segments of a spherical coordinate system. Under the cursor can display
information about the numerical value of the psi-function in the current point on the screen. Also adjusts the brightness of the
boundary output displayed values, ways of demonstration inside the
cutout area. There is a switch to flat mode 2D (XY and ZX plane sections). Exports of
three-dimensional and two-dimensional data into simple data formats,
including a Surfer ASCII grid file. The application does not require
installation. This application will be useful to students of technical
and nontechnical skills, beginner to learn quantum physics of the atom.
.
Download Atom Orbitals v.1.5
updated 2013/12/01
SOME HISTORY
Even at the institute's physics
course I was just fascinated by the fundamental nature and simplicity
of the exact solution of the Schrodinger equation for hydrogen ion. The
significance of this decision for science can not measure. I do believe
that the symbol of XX-th century should not be overexposed to all of E
= mc ^ 2, but the Schrodinger's letter PSI.
I began to experiment in the DOS with palettes, and his friends spent
modules in DOS mode, drawing 256, a 65K and 16M colors, pick out the
plane and 3D wave function psi(x, y, z). Here are some of my first
exercises.
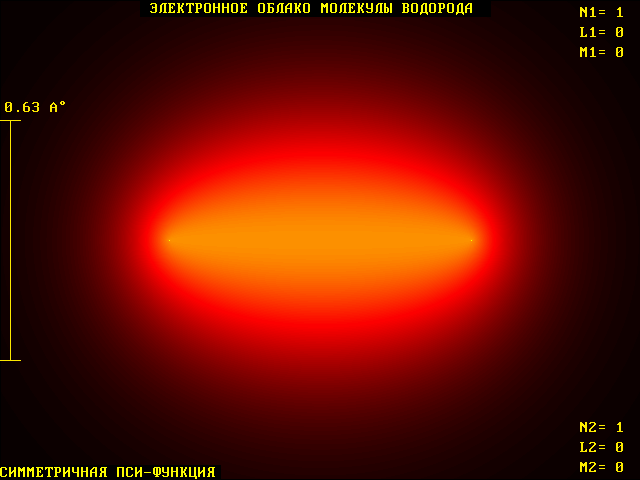
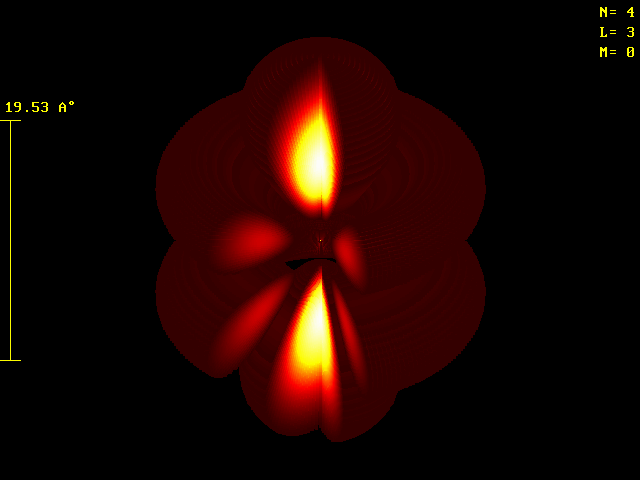
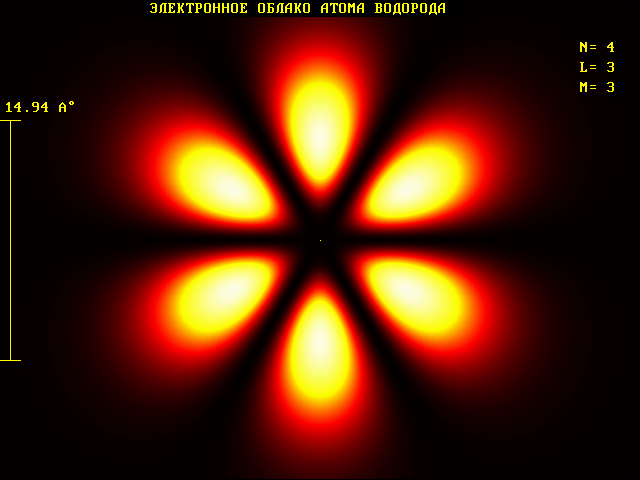
Eventually,
I gained experience programming in Windows. Created in 2006 application
that can draw the large display option and a square wave psi-function
in three-dimensional projections and the projections on the two
coordinate planes.
GENERAL PRINCIPLES
The fundamentals of drawing any centrally symmetric functions of the form u (x, y, z) must be:
* The presence of a centrally symmetric notch, to see the insides:
* Availability of discrimination threshold values
for display (ie values less than some should not be displayed). Either
can be to create the effect isosurfaces only output values lying in
certain intervals.
* Displays the lines of coordinates that put them at the graduations of scale.
* Inspector values of the mouse cursor on the guidance on drawing colored image areas.
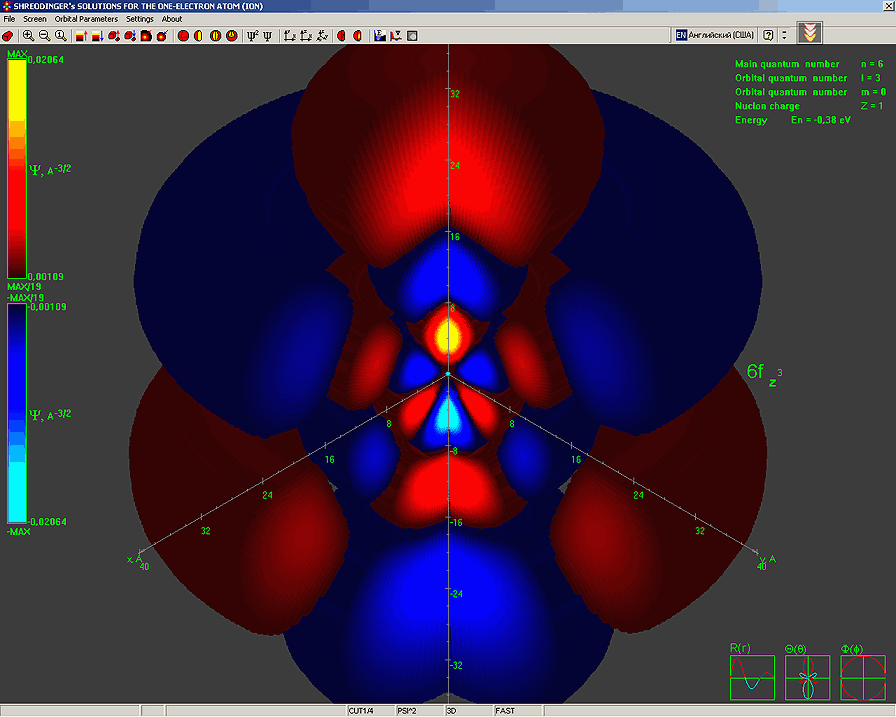
SCREENSHOT
SOME GRAPHIC RESULTS
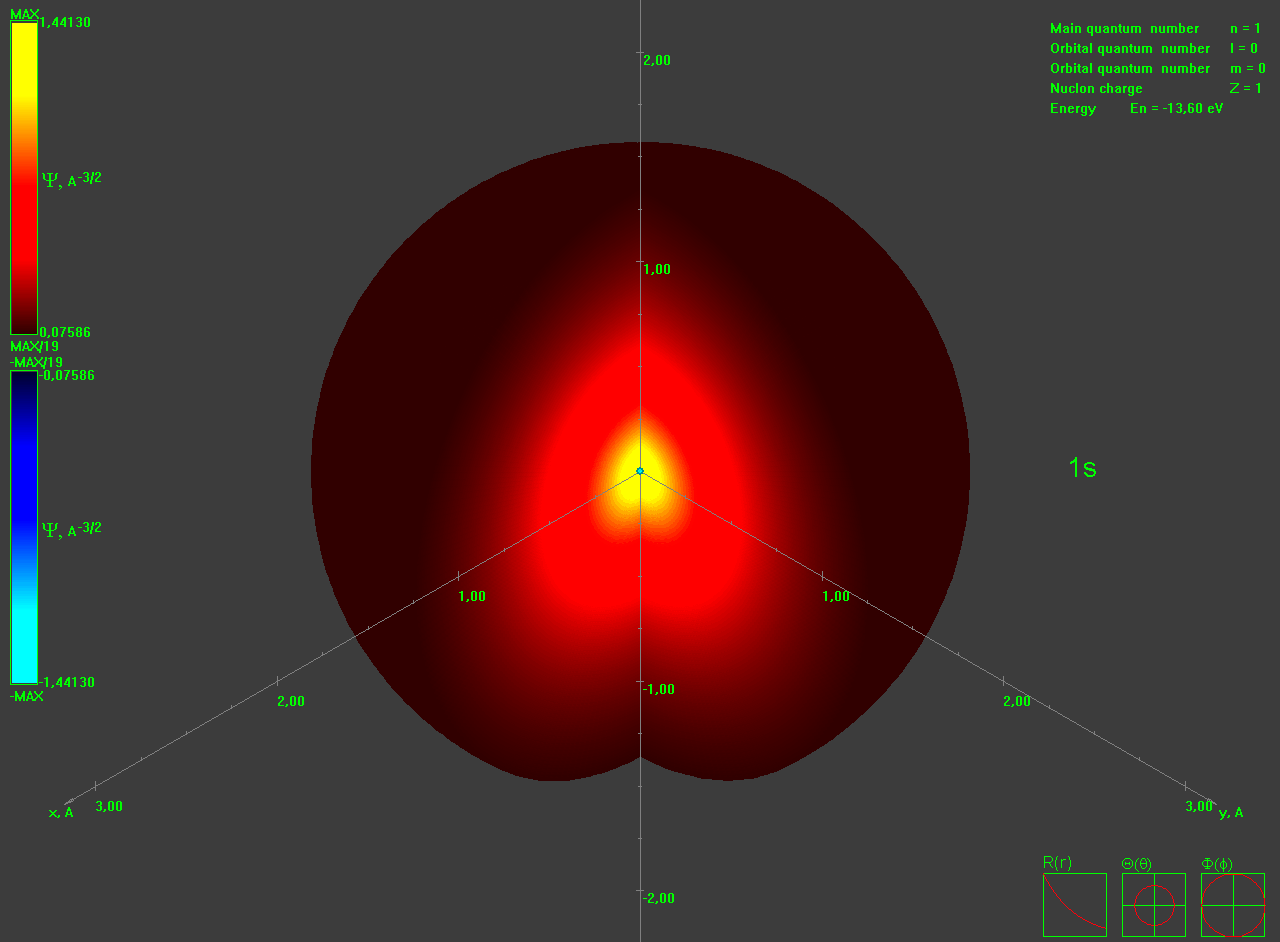
1s - state
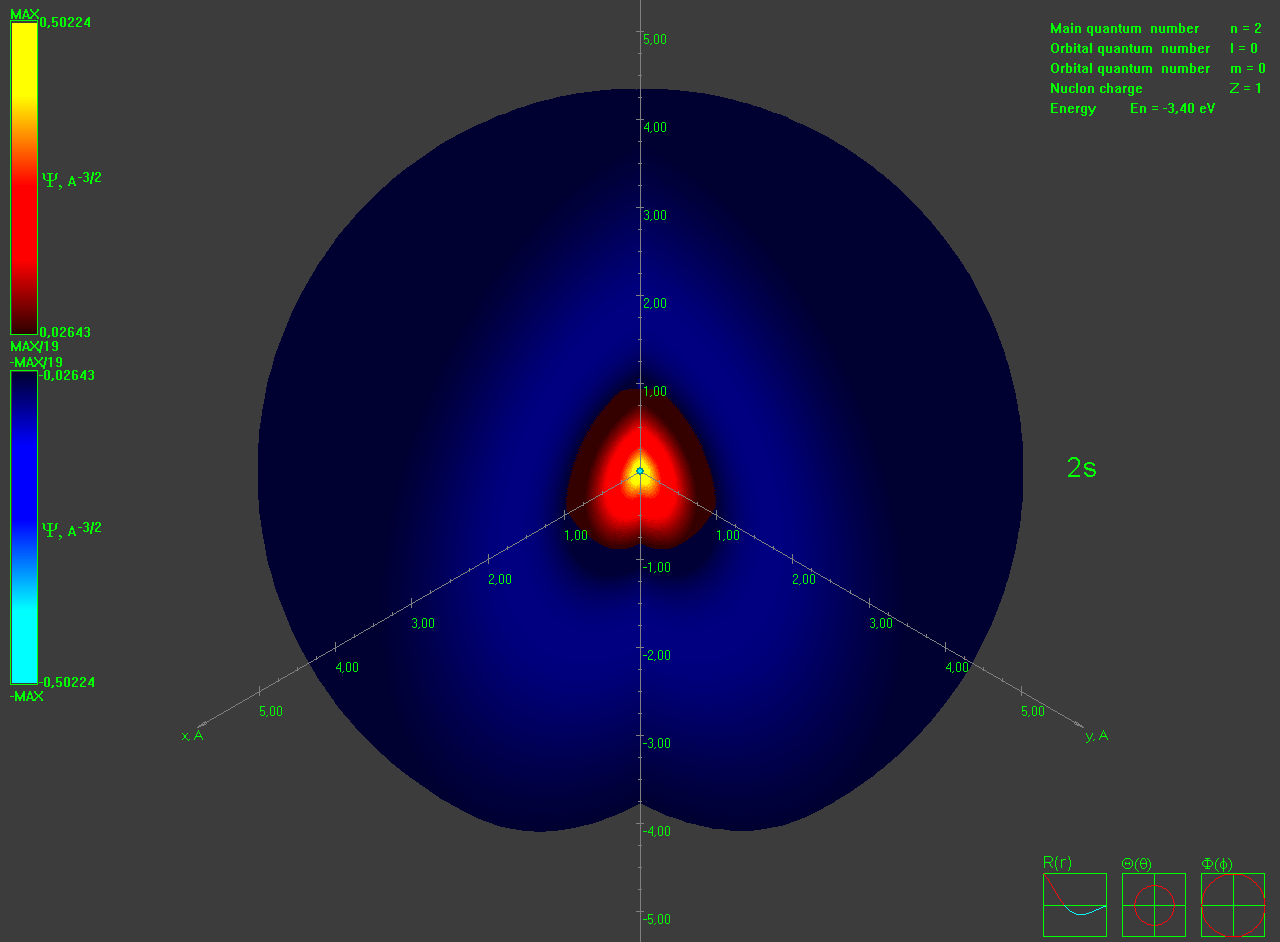
2s - state
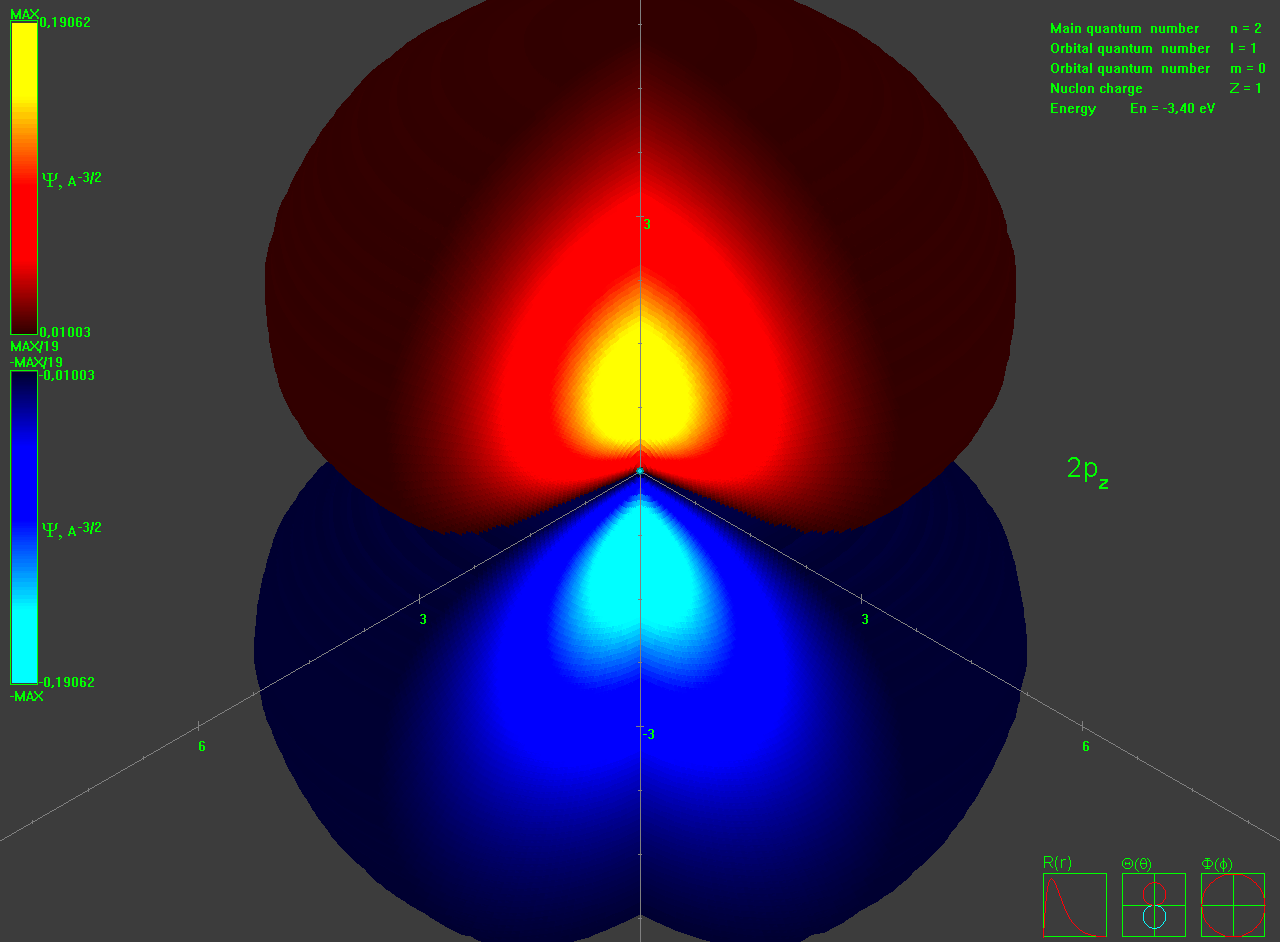
2pz - state
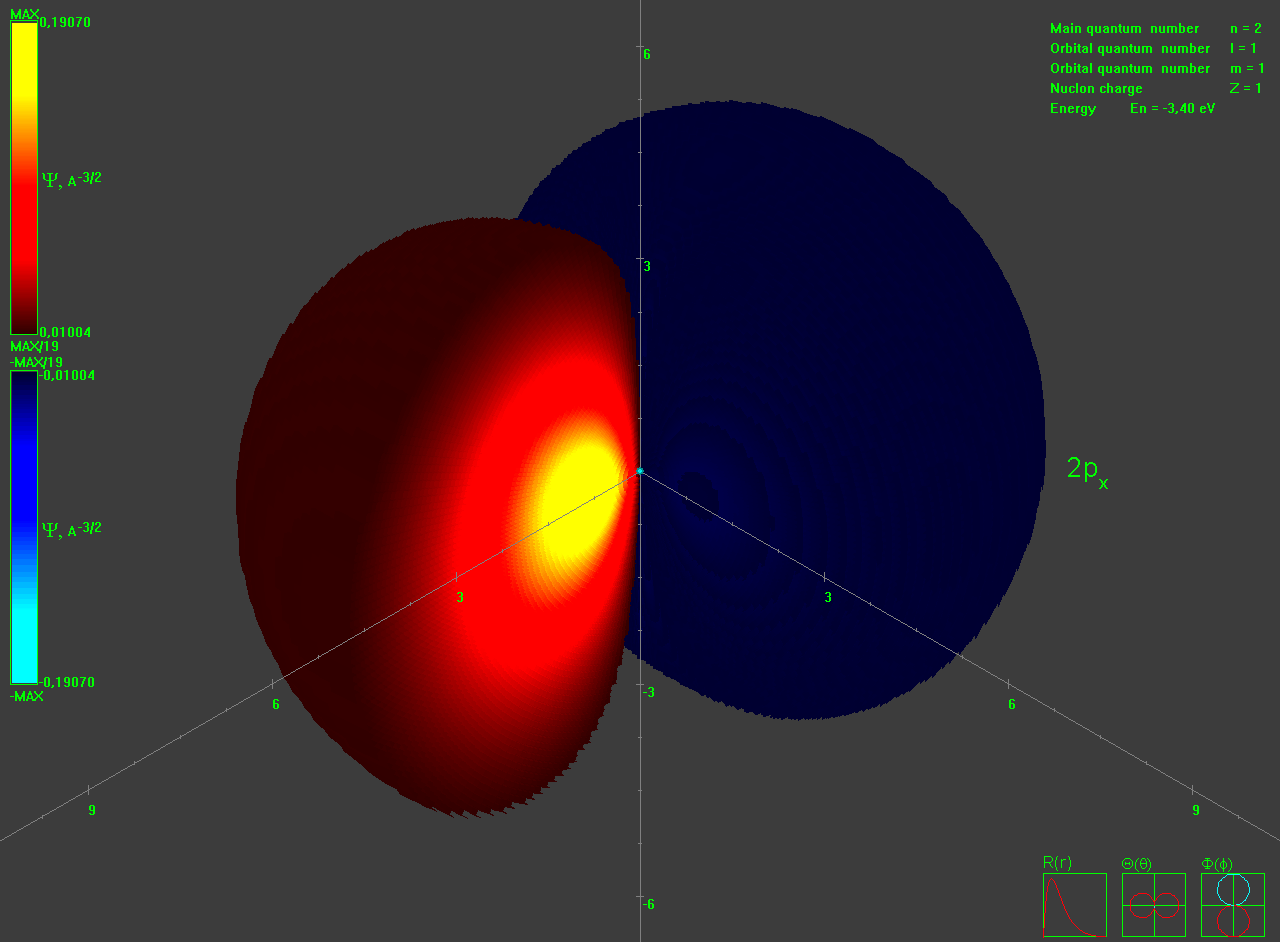
2px - state
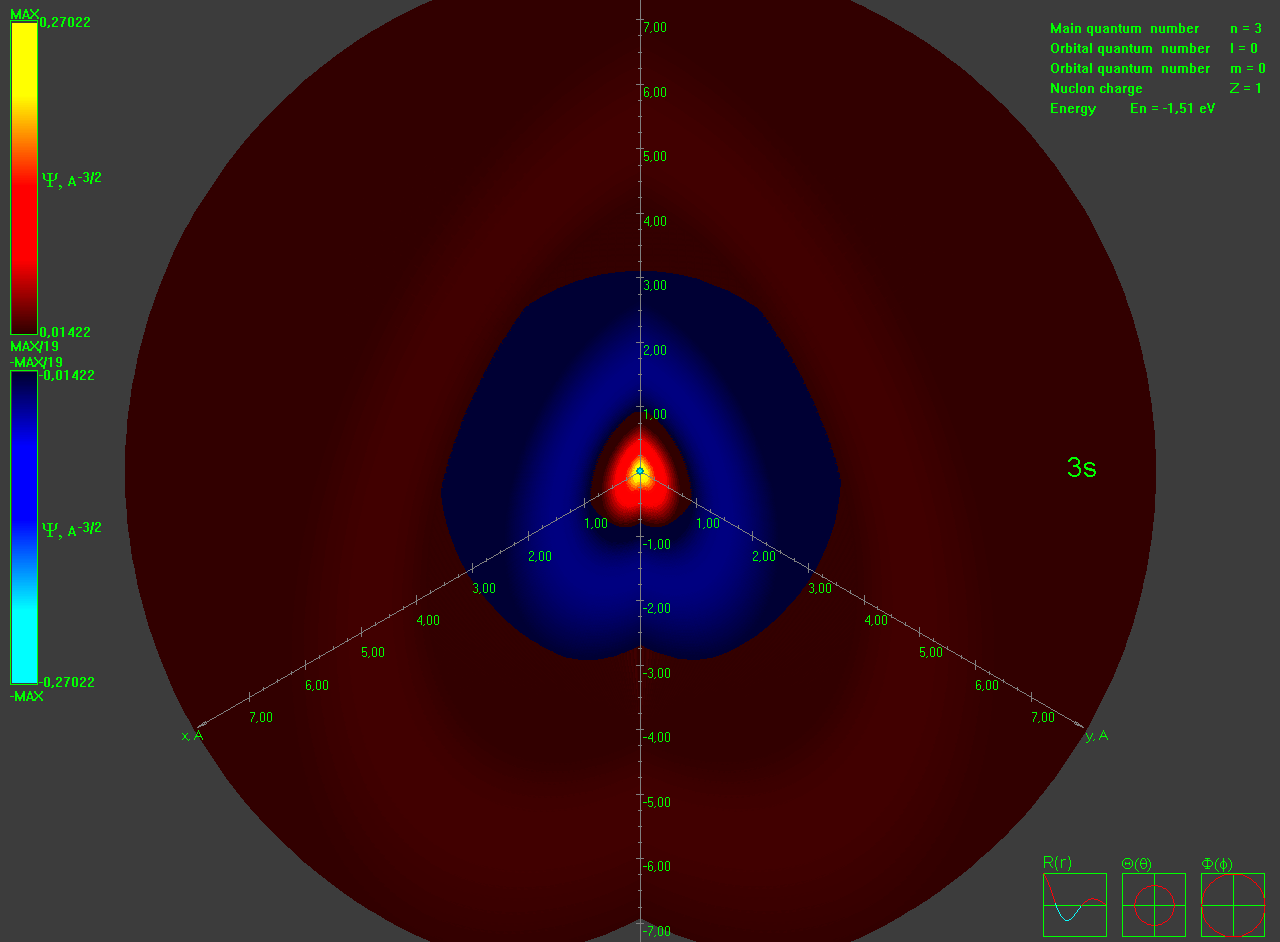
3s - state
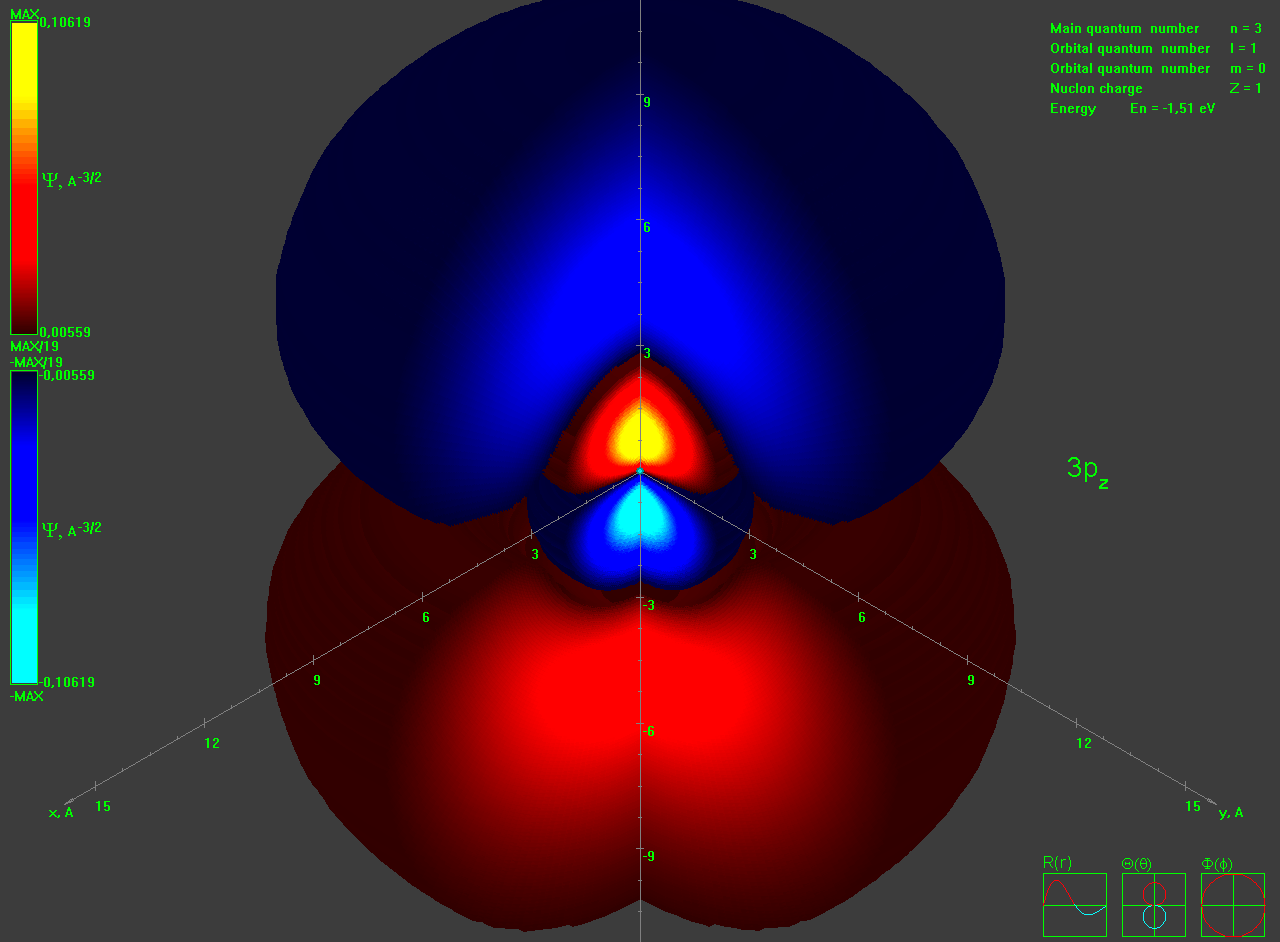
3pz - state
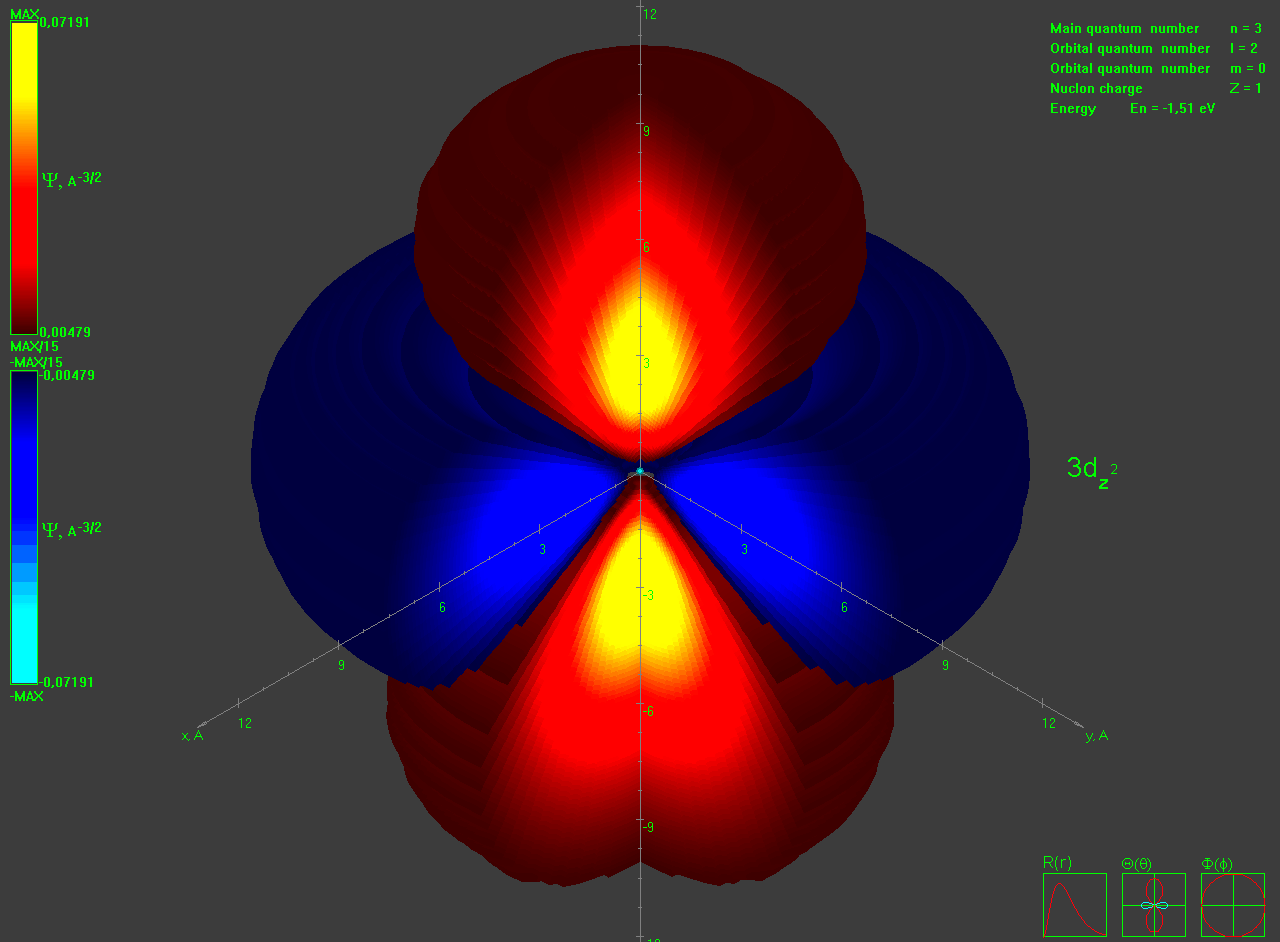
3dz2 - state
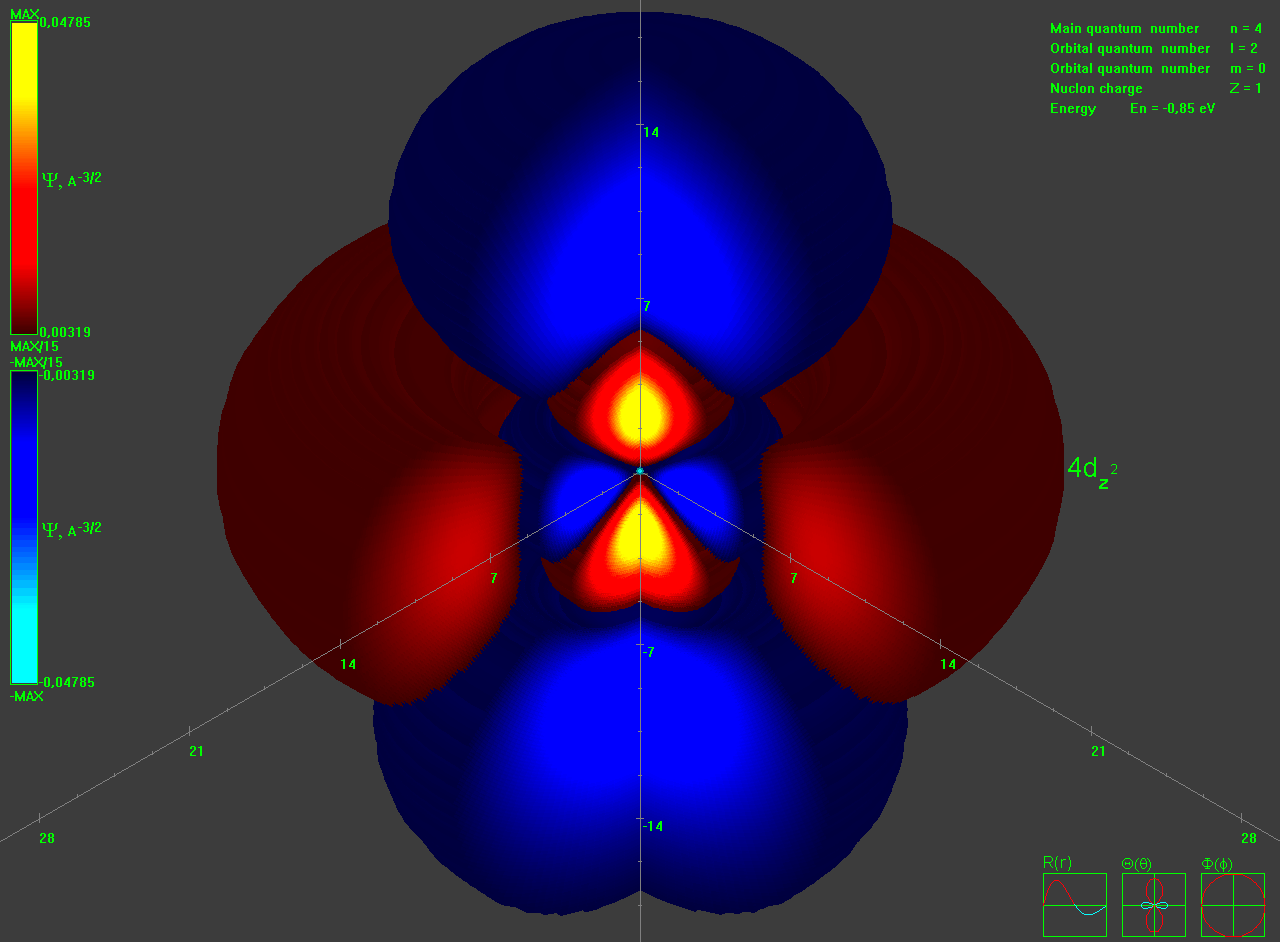
4dz2 - state
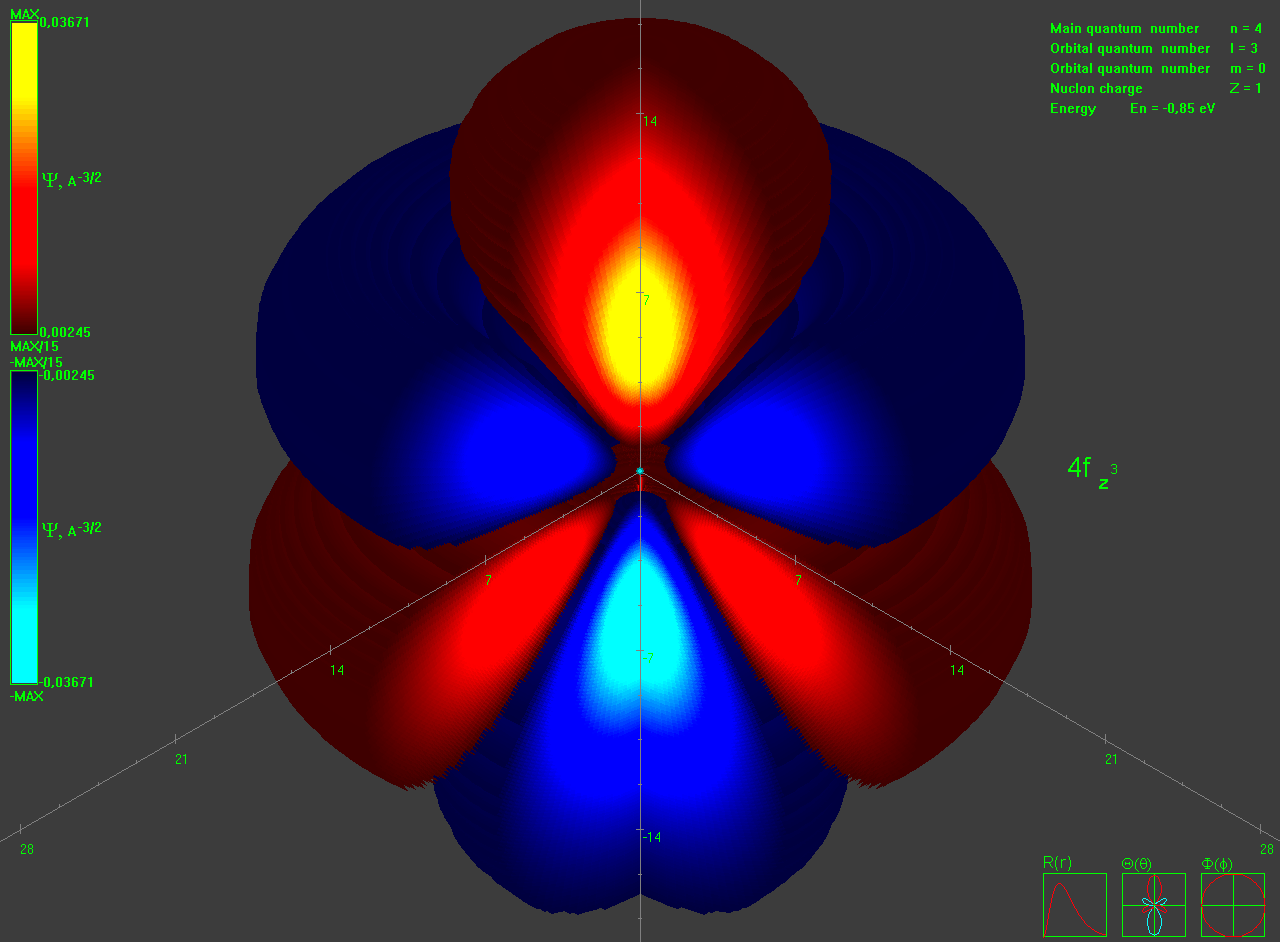
4fz3 - state
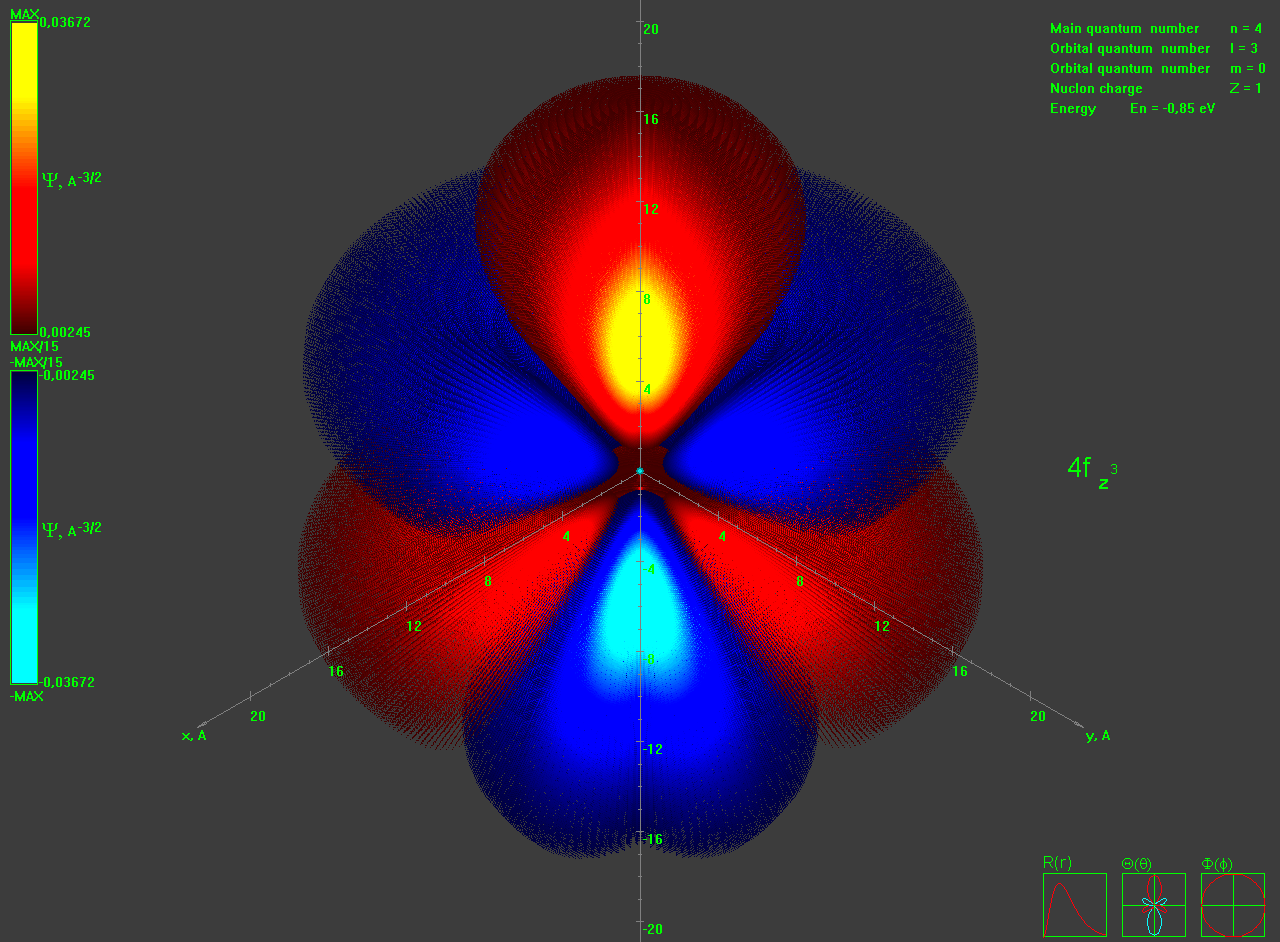
4fz3 - state dots drawing
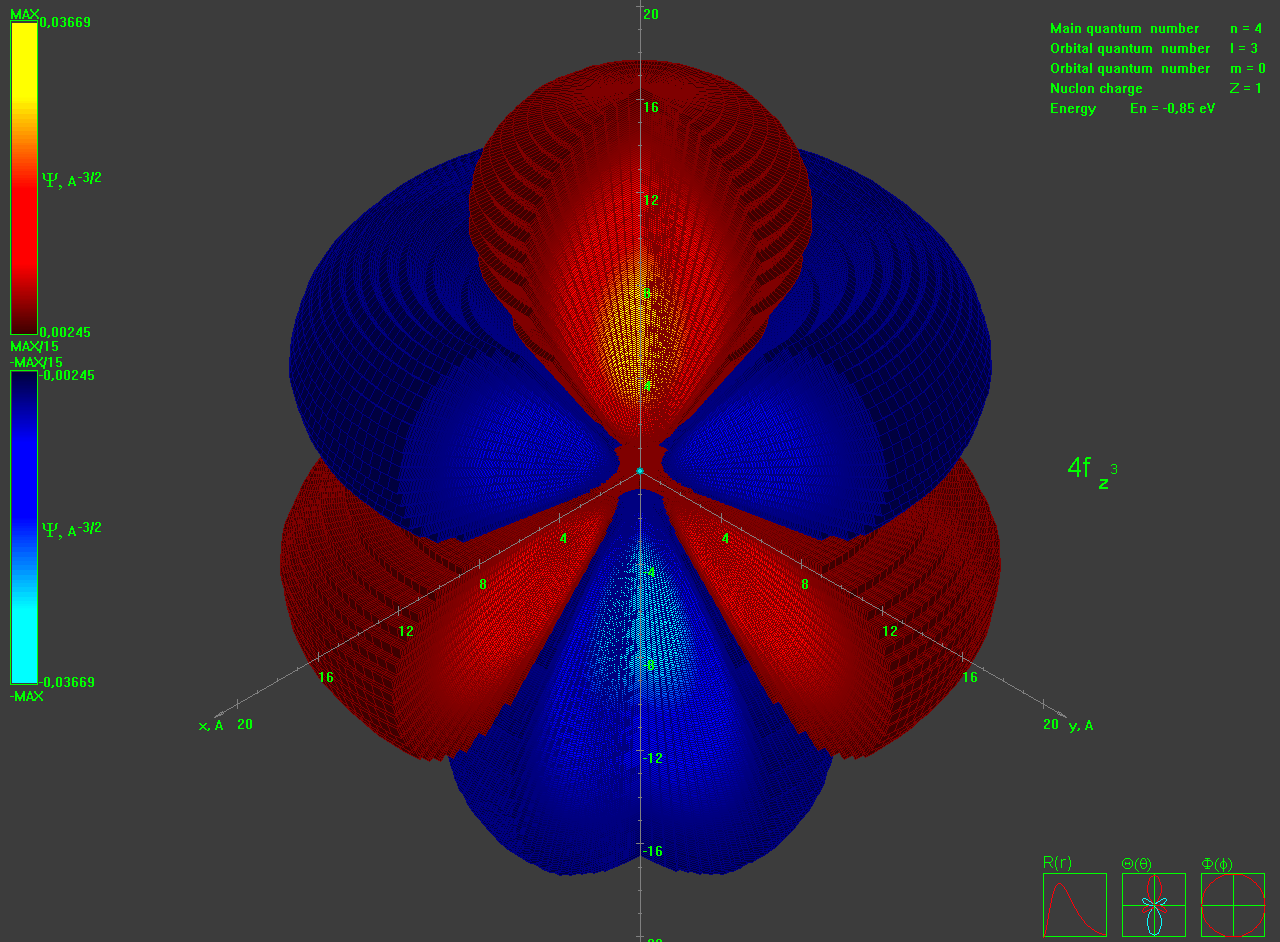
4fz3 - state color grid drawing
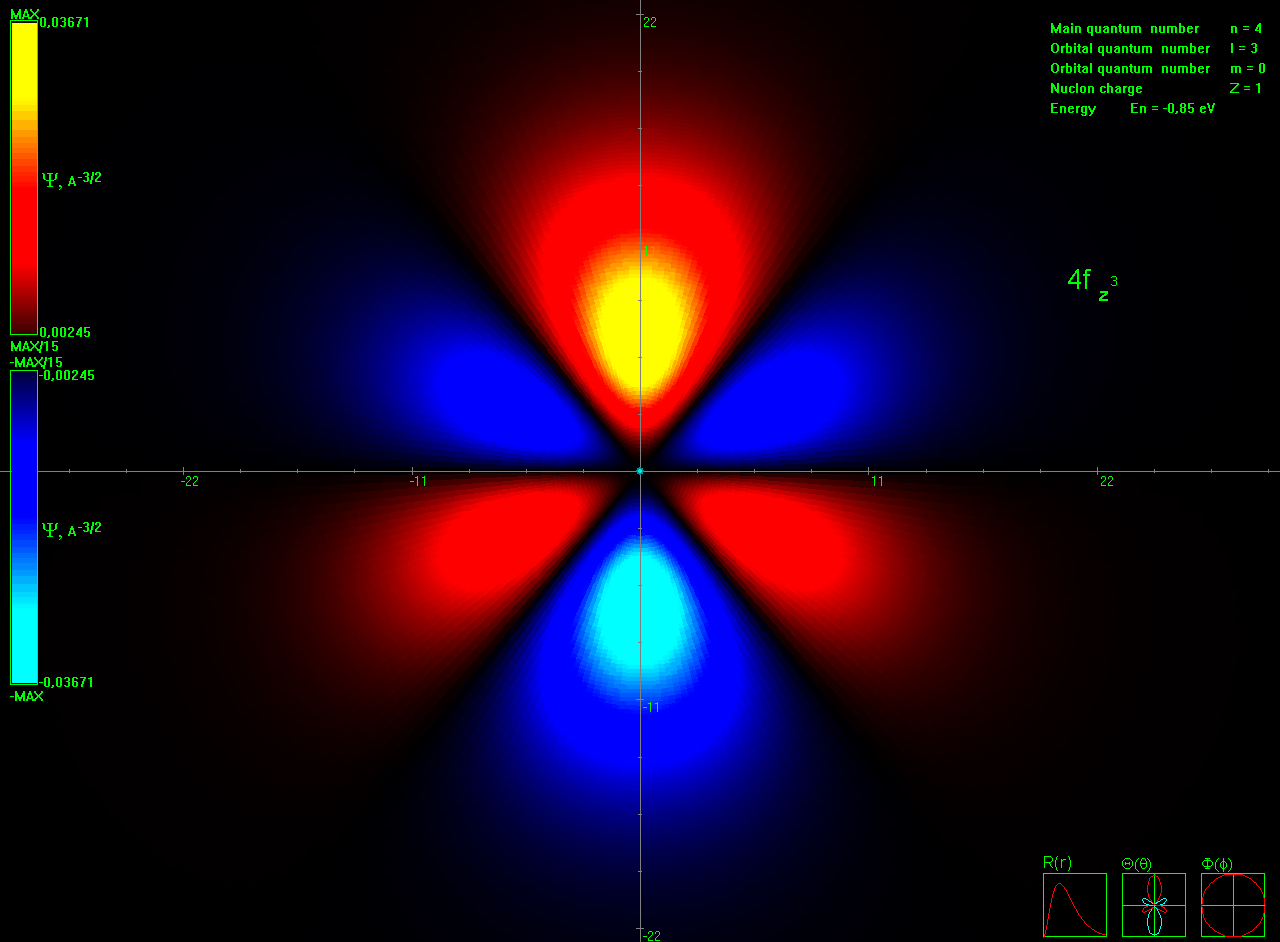
4fz3 - state in ZX plane
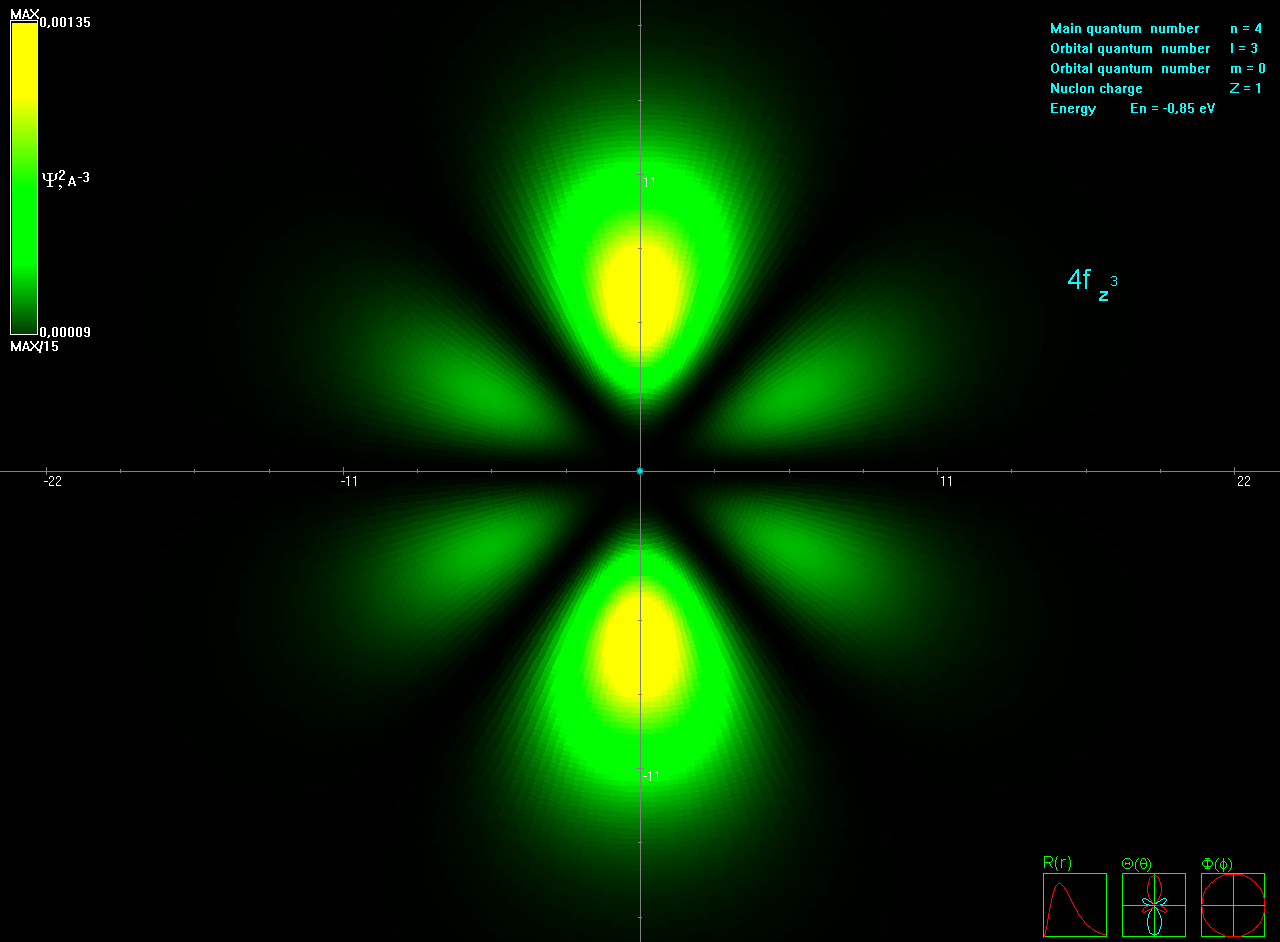
4fz3 - state PSI2 in ZX plane
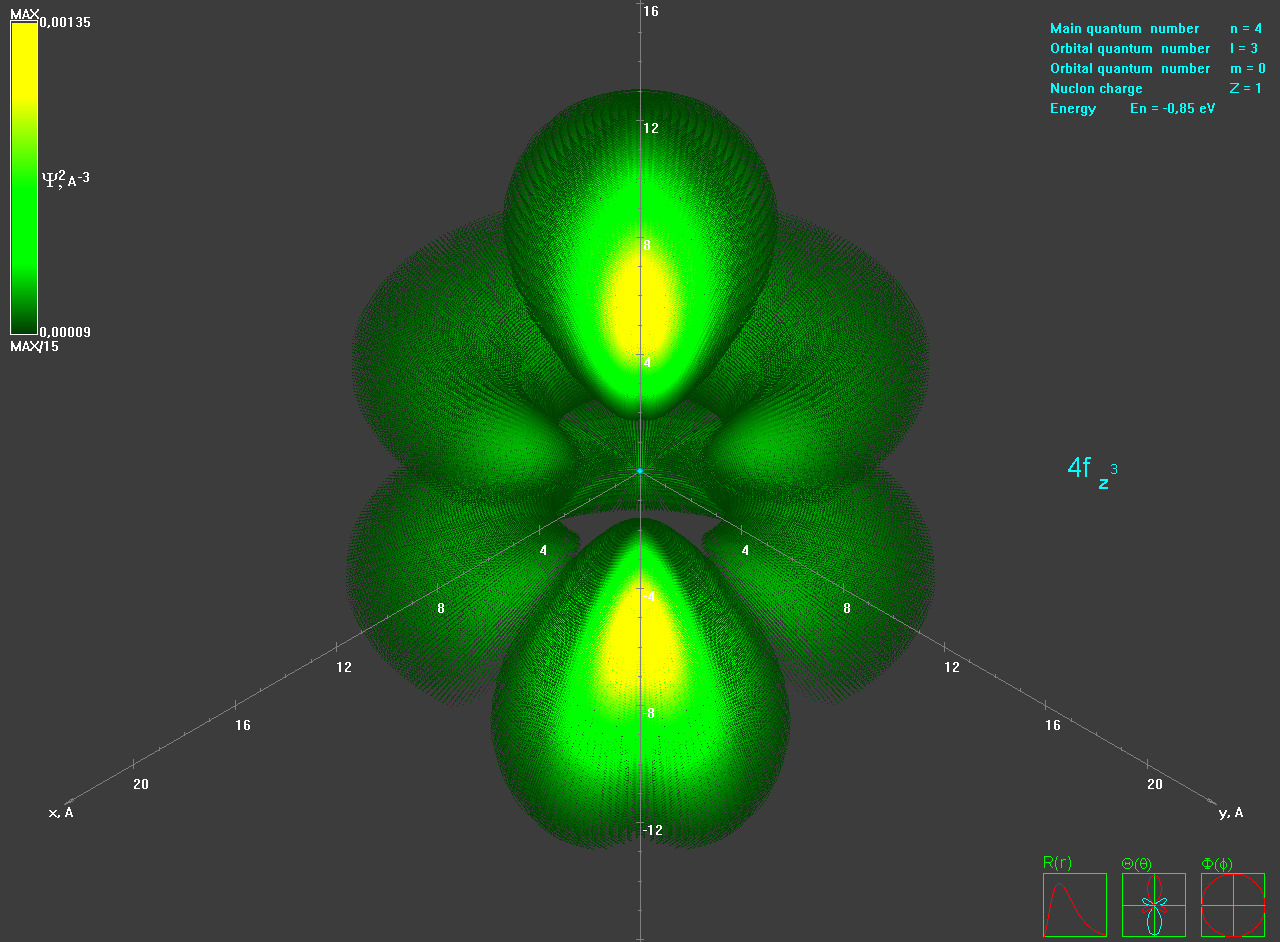
4fz3 - state PSI2 dots drawing
Taraz Yu. Zavedy (С), 2006-2010,
E-mail: taras_zavedy@mail.ru, taras_zavedy@mail333.com, taras_zavedy@pisem.net


